Há alguns anos, tenho trabalhado exclusivamente com o Oracle Enterprise Edition, sem dúvida a melhor edição. No entanto, recentemente, precisei atender um cliente que utilizava o Oracle Standard Edition. Esse cliente, em particular, relatava problemas de lentidão. Sem conhecer o ambiente e seu histórico, iniciei a análise verificando o consumo de recursos e, em seguida, examinei o Statspack.
Para quem está acostumado com o AWR e o Enterprise Manager, é evidente o quanto o Statspack pode ser útil. No entanto, em comparação com o AWR, sabemos que o Statspack apresenta os dados em formato puramente textual, tornando sua leitura e interpretação mais complexas e demoradas.
Com o objetivo de otimizar a análise de forma mais rápida e assertiva, comecei a pesquisar ferramentas que pudessem me auxiliar. Foi então que encontrei o jas-min, desenvolvido por Kamil Stawiarski ([email protected]) e Radosław Kut ([email protected]).
Ao descobrir essa ferramenta, fiquei impressionado e decidi instalá-la para explorá-la melhor. No início, encontrei alguns desafios durante a instalação, mas, ao entrar em contato com Kamil, fui prontamente auxiliado.
Diante da experiência positiva, resolvi compartilhar este post para incentivar o uso do jas-min e demonstrar, de maneira simples, como instalá-lo e utilizá-lo. Trata-se de uma ferramenta poderosa e altamente recomendada para aprimorar a análise do Statspack.
1 – Links sobre a ferramenta e onde baixar:
https://github.com/ora600pl/jas-min
https://blog.ora-600.pl/2024/12/13/jas-min/
https://www.rust-lang.org/tools/install
2 – Instalação no Oracle Linux 8:
#Directories created to download the tool and store statspack reports:
[root@localhost ~]# mkdir -p /statspack/software
[root@localhost ~]# mkdir -p /statspack/software/relatorios
[root@localhost ~]# yum -y install git
#Install rust
[root@localhost ~]# curl --proto '=https' --tlsv1.2 -sSf https://sh.rustup.rs | sh
# Apply the environment variables
. "$HOME/.cargo/env"
#
[root@localhost ~]# cd /statspack/software
[root@localhost ~]# git clone https://github.com/ora600pl/jas-min
[root@localhost jas-min]# pwd
/root/statspack/software/jas-min
[root@localhost jas-min]# cargo build --release
3 – Copie o script gen_statspack_reps.sh da ferramenta para o servidor de banco de dados Oracle, e execute para gerar os relatórios do statspack:
[root@localhost ~]# su - oracle
[oracle@localhost ~]$ export NLS_LANG=AMERICAN_AMERICA.AL32UTF8
[oracle@localhost ~]$ ./gen_statspack_reps.sh
4 – Copie todos os arquivos gerados do statspack para o diretório /root/statspack/relatorios/ em seguida execute a ferramenta jas-min para que ela possa gerar os relatórios:
[root@localhost relatorios]# unzip statspack_relatorio.zip
Archive:  statspack_relatorio.zip
  inflating: sp_13390_13391.txt
  inflating: sp_13391_13392.txt
  inflating: sp_13392_13393.txt
  inflating: sp_13393_13394.txt
  inflating: sp_13394_13395.txt
  inflating: sp_13395_13396.txt
  inflating: sp_13396_13397.txt
  inflating: sp_13397_13398.txt
  inflating: sp_13398_13399.txt
  inflating: sp_13399_13400.txt
  inflating: sp_13400_13401.txt
  inflating: sp_13401_13402.txt
  inflating: sp_13402_13403.txt
  inflating: sp_13403_13404.txt
  inflating: sp_13404_13405.txt
  inflating: sp_13405_13406.txt
  inflating: sp_13406_13407.txt
  inflating: sp_13407_13408.txt
  inflating: sp_13408_13409.txt
  inflating: sp_13409_13410.txt
  inflating: sp_13410_13411.txt
  inflating: sp_13411_13412.txt
  inflating: sp_13412_13413.txt
  inflating: sp_13413_13414.txt
  inflating: sp_13414_13415.txt
  inflating: sp_13415_13416.txt
  inflating: sp_13416_13417.txt
  inflating: sp_13417_13418.txt
  inflating: sp_13418_13419.txt
  inflating: sp_13419_13420.txt
  inflating: sp_13420_13421.txt
  inflating: sp_13421_13422.txt
  inflating: sp_13422_13423.txt
  inflating: sp_13423_13424.txt
  inflating: sp_13424_13425.txt
  inflating: sp_13425_13426.txt
  inflating: sp_13426_13427.txt
  inflating: sp_13427_13428.txt
  inflating: sp_13428_13429.txt
  inflating: sp_13429_13430.txt
  inflating: sp_13430_13431.txt
  inflating: sp_13431_13432.txt
  inflating: sp_13432_13433.txt
  inflating: sp_13433_13434.txt
  inflating: sp_13434_13435.txt
  inflating: sp_13435_13436.txt
  inflating: sp_13436_13437.txt
  inflating: sp_13437_13438.txt
  inflating: sp_13438_13439.txt
  inflating: sp_13439_13440.txt
  inflating: sp_13440_13441.txt
  inflating: sp_13441_13442.txt
  inflating: sp_13442_13443.txt
  inflating: sp_13443_13444.txt
  inflating: sp_13444_13445.txt
  inflating: sp_13445_13446.txt
  inflating: sp_13446_13447.txt
  inflating: sp_13447_13448.txt
  inflating: sp_13448_13449.txt
5 – Execute a ferramenta jas-min, informando o diretório onde estão armazenados os arquivos do Statspack:
[root@localhost ~]# cd statspack/software/jas-min/target/release/
[root@localhost release]# ls -lart
total 10124
drwxr-xr-x. 2 root root 6 Mar 13 13:20 incremental
drwxr-xr-x. 2 root root 6 Mar 13 13:20 examples
-rw-r--r--. 1 root root 0 Mar 13 13:20 .cargo-lock
drwxr-xr-x. 3 root root 81 Mar 13 13:20 ..
drwxr-xr-x. 255 root root 12288 Mar 13 13:20 .fingerprint
drwxr-xr-x. 44 root root 4096 Mar 13 13:20 build
-rwxr-xr-x. 2 root root 10285648 Mar 13 13:22 jas-min
drwxr-xr-x. 2 root root 36864 Mar 13 13:22 deps
-rw-r--r--. 1 root root 350 Mar 13 13:22 jas-min.d
drwxr-xr-x. 7 root root 137 Mar 13 13:22 .
[root@localhost release]# ./jas-min -d /root/statspack/relatorios/
JAS-MIN v0.4.0
==== PARSING DIRECTORY DATA ===
Number of reports parsed: 59
Starting output capture to: /root/statspack/relatorios/.txt
==== ANALYZING ===
Analyzing a peak in sp_13390_13391.txt (06-Mar-25 00:00:00) for ratio: [0.10/0.20] = 0.50
Analyzing a peak in sp_13411_13412.txt (06-Mar-25 05:15:00) for ratio: [0.10/0.20] = 0.50
Analyzing a peak in sp_13412_13413.txt (06-Mar-25 05:30:00) for ratio: [0.10/0.20] = 0.50
Analyzing a peak in sp_13423_13424.txt (06-Mar-25 08:15:00) for ratio: [0.30/0.50] = 0.60
Analyzing a peak in sp_13427_13428.txt (06-Mar-25 09:15:00) for ratio: [0.50/0.80] = 0.62
Analyzing a peak in sp_13435_13436.txt (06-Mar-25 11:15:00) for ratio: [0.10/0.20] = 0.50
Analyzing a peak in sp_13436_13437.txt (06-Mar-25 11:30:00) for ratio: [0.10/0.20] = 0.50
Analyzing a peak in sp_13437_13438.txt (06-Mar-25 11:45:00) for ratio: [0.10/0.20] = 0.50
Analyzing a peak in sp_13439_13440.txt (06-Mar-25 12:15:00) for ratio: [0.50/0.80] = 0.62
Analyzing a peak in sp_13443_13444.txt (06-Mar-25 13:15:00) for ratio: [0.50/0.80] = 0.62
Analyzing a peak in sp_13445_13446.txt (06-Mar-25 13:45:00) for ratio: [0.50/0.80] = 0.62
==== CREATING PLOTS ===
Saved plots for Foreground events to '/root/statspack/relatorios/.html_reports/fg_*'
Saved plots for Background events to '/root/statspack/relatorios/.html_reports/bg_*'
==== PREPARING RESULTS ===
Load Profile and Top Stats
==== REPORTING RESULTS ===
Statistical Computations:
-------------------------
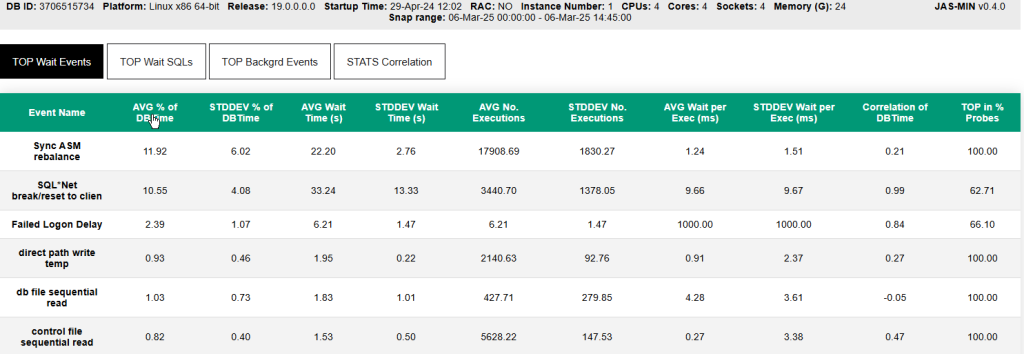
Foreground Wait Events
Sync ASM rebalance
--- Correlation with DB Time: 0.21 Marked as TOP in 100.00% of probes
--- AVG PCT of DB Time: 11.92 STDDEV PCT of DB Time: 6.02
--- AVG Wait Time (s): 22.20 STDDEV Wait Time (s): 2.76
--- AVG No. executions: 17908.69 STDDEV No. executions: 1830.27
--- AVG wait/exec (ms): 1.24 STDDEV wait/exec (ms): 1.51
SQL*Net break/reset to clien
--- Correlation with DB Time: 0.99 Marked as TOP in 62.71% of probes
--- AVG PCT of DB Time: 10.55 STDDEV PCT of DB Time: 4.08
--- AVG Wait Time (s): 33.24 STDDEV Wait Time (s): 13.33
--- AVG No. executions: 3440.70 STDDEV No. executions: 1378.05
--- AVG wait/exec (ms): 9.66 STDDEV wait/exec (ms): 9.67
Failed Logon Delay
--- Correlation with DB Time: 0.84 Marked as TOP in 66.10% of probes
--- AVG PCT of DB Time: 2.39 STDDEV PCT of DB Time: 1.07
--- AVG Wait Time (s): 6.21 STDDEV Wait Time (s): 1.47
--- AVG No. executions: 6.21 STDDEV No. executions: 1.47
--- AVG wait/exec (ms): 1000.00 STDDEV wait/exec (ms): 1000.00
direct path write temp
--- Correlation with DB Time: 0.27 Marked as TOP in 100.00% of probes
--- AVG PCT of DB Time: 0.93 STDDEV PCT of DB Time: 0.46
--- AVG Wait Time (s): 1.95 STDDEV Wait Time (s): 0.22
--- AVG No. executions: 2140.63 STDDEV No. executions: 92.76
--- AVG wait/exec (ms): 0.91 STDDEV wait/exec (ms): 2.37
db file sequential read
--- Correlation with DB Time: -0.05 Marked as TOP in 100.00% of probes
--- AVG PCT of DB Time: 1.03 STDDEV PCT of DB Time: 0.73
--- AVG Wait Time (s): 1.83 STDDEV Wait Time (s): 1.01
--- AVG No. executions: 427.71 STDDEV No. executions: 279.85
--- AVG wait/exec (ms): 4.28 STDDEV wait/exec (ms): 3.61
control file sequential read
--- Correlation with DB Time: 0.47 Marked as TOP in 100.00% of probes
--- AVG PCT of DB Time: 0.82 STDDEV PCT of DB Time: 0.40
--- AVG Wait Time (s): 1.53 STDDEV Wait Time (s): 0.50
--- AVG No. executions: 5628.22 STDDEV No. executions: 147.53
--- AVG wait/exec (ms): 0.27 STDDEV wait/exec (ms): 3.38
library cache: mutex X
--- Correlation with DB Time: 0.88 Marked as TOP in 96.61% of probes
--- AVG PCT of DB Time: 0.53 STDDEV PCT of DB Time: 0.50
--- AVG Wait Time (s): 1.54 STDDEV Wait Time (s): 1.49
--- AVG No. executions: 645.49 STDDEV No. executions: 635.54
--- AVG wait/exec (ms): 2.39 STDDEV wait/exec (ms): 2.34
PGA memory operation
--- Correlation with DB Time: 0.98 Marked as TOP in 100.00% of probes
--- AVG PCT of DB Time: 0.34 STDDEV PCT of DB Time: 0.20
--- AVG Wait Time (s): 1.07 STDDEV Wait Time (s): 1.01
--- AVG No. executions: 42244.17 STDDEV No. executions: 34301.55
--- AVG wait/exec (ms): 0.03 STDDEV wait/exec (ms): 0.03
ASM file metadata operation
--- Correlation with DB Time: NaN Marked as TOP in 100.00% of probes
--- AVG PCT of DB Time: 0.33 STDDEV PCT of DB Time: 0.17
--- AVG Wait Time (s): 1.00 STDDEV Wait Time (s): 0.00
--- AVG No. executions: 2984.80 STDDEV No. executions: 305.06
--- AVG wait/exec (ms): 0.34 STDDEV wait/exec (ms): 0.00
log file sync
--- Correlation with DB Time: 0.80 Marked as TOP in 100.00% of probes
--- AVG PCT of DB Time: 0.30 STDDEV PCT of DB Time: 0.33
--- AVG Wait Time (s): 0.92 STDDEV Wait Time (s): 1.00
--- AVG No. executions: 228.58 STDDEV No. executions: 198.56
--- AVG wait/exec (ms): 4.00 STDDEV wait/exec (ms): 5.02
db file scattered read
--- Correlation with DB Time: 0.10 Marked as TOP in 28.81% of probes
--- AVG PCT of DB Time: 0.17 STDDEV PCT of DB Time: 0.25
--- AVG Wait Time (s): 0.24 STDDEV Wait Time (s): 0.55
--- AVG No. executions: 130.00 STDDEV No. executions: 266.66
--- AVG wait/exec (ms): 1.81 STDDEV wait/exec (ms): 2.05
latch: shared pool
--- Correlation with DB Time: -0.08 Marked as TOP in 71.19% of probes
--- AVG PCT of DB Time: 0.10 STDDEV PCT of DB Time: 0.30
--- AVG Wait Time (s): 0.07 STDDEV Wait Time (s): 0.34
--- AVG No. executions: 1134.57 STDDEV No. executions: 744.05
--- AVG wait/exec (ms): 0.06 STDDEV wait/exec (ms): 0.45
CSS operation: action
--- Correlation with DB Time: NaN Marked as TOP in 100.00% of probes
--- AVG PCT of DB Time: 0.00 STDDEV PCT of DB Time: 0.00
--- AVG Wait Time (s): 0.00 STDDEV Wait Time (s): 0.00
--- AVG No. executions: 3.00 STDDEV No. executions: 0.00
--- AVG wait/exec (ms): 0.00 STDDEV wait/exec (ms): NaN
SQL*Net message to client
--- Correlation with DB Time: NaN Marked as TOP in 100.00% of probes
--- AVG PCT of DB Time: 0.00 STDDEV PCT of DB Time: 0.00
--- AVG Wait Time (s): 0.00 STDDEV Wait Time (s): 0.00
--- AVG No. executions: 14525.32 STDDEV No. executions: 12386.71
--- AVG wait/exec (ms): 0.00 STDDEV wait/exec (ms): 0.00
SQL*Net more data from clien
--- Correlation with DB Time: NaN Marked as TOP in 22.03% of probes
--- AVG PCT of DB Time: 0.00 STDDEV PCT of DB Time: 0.00
--- AVG Wait Time (s): 0.00 STDDEV Wait Time (s): 0.00
--- AVG No. executions: 106.38 STDDEV No. executions: 98.94
--- AVG wait/exec (ms): 0.00 STDDEV wait/exec (ms): 0.00
cursor: pin S
--- Correlation with DB Time: NaN Marked as TOP in 67.80% of probes
--- AVG PCT of DB Time: 0.01 STDDEV PCT of DB Time: 0.02
--- AVG Wait Time (s): 0.00 STDDEV Wait Time (s): 0.00
--- AVG No. executions: 67.20 STDDEV No. executions: 43.49
--- AVG wait/exec (ms): 0.00 STDDEV wait/exec (ms): 0.00
latch: call allocation
--- Correlation with DB Time: NaN Marked as TOP in 42.37% of probes
--- AVG PCT of DB Time: 0.00 STDDEV PCT of DB Time: 0.02
--- AVG Wait Time (s): 0.00 STDDEV Wait Time (s): 0.00
--- AVG No. executions: 37.60 STDDEV No. executions: 24.82
--- AVG wait/exec (ms): 0.00 STDDEV wait/exec (ms): 0.00
library cache load lock
--- Correlation with DB Time: NaN Marked as TOP in 57.63% of probes
--- AVG PCT of DB Time: 0.00 STDDEV PCT of DB Time: 0.00
--- AVG Wait Time (s): 0.00 STDDEV Wait Time (s): 0.00
--- AVG No. executions: 66.68 STDDEV No. executions: 30.32
--- AVG wait/exec (ms): 0.00 STDDEV wait/exec (ms): 0.00
Background Wait Events
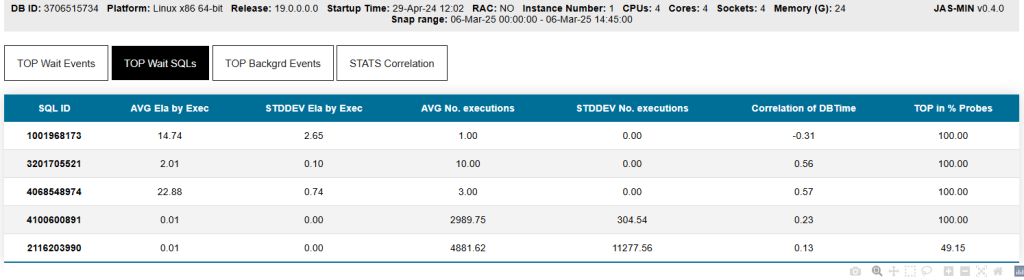
SQLs
1001968173 Other Top Sections: SQL GETS [100.00%] | SQL READS [100.00%] | SQL CPU [100.00%]
--- Correlation with DB Time: -0.31 Marked as TOP in 100.00% of probes
--- AVG Ela by Exec: 14.74 STDDEV Ela by Exec: 2.65
--- AVG No. executions: 1.00 STDDEV No. executions: 0.00
MODULE: DBMS_SCHEDULER
+ | Sync ASM rebalance : -0.04
+ | SQL*Net break/reset to clien : -0.32
+ | Failed Logon Delay : -0.39
+ | direct path write temp : -0.07
+ | db file sequential read : 0.24
+ | control file sequential read : -0.22
+ | library cache: mutex X : -0.33
+ | PGA memory operation : -0.29
+ | ASM file metadata operation : NaN
+ | log file sync : -0.26
+ | db file scattered read : -0.02
+ | latch: shared pool : -0.09
+ | CSS operation: action : NaN
+ | SQL*Net message to client : NaN
+ | SQL*Net more data from clien : NaN
+ | cursor: pin S : NaN
+ | latch: call allocation : NaN
+ | library cache load lock : NaN
3201705521 Other Top Sections: SQL GETS [45.76%] | SQL CPU [45.76%] | SQL READS [45.76%]
--- Correlation with DB Time: 0.56 Marked as TOP in 100.00% of probes
--- AVG Ela by Exec: 2.01 STDDEV Ela by Exec: 0.10
--- AVG No. executions: 10.00 STDDEV No. executions: 0.00
MODULE: zabbix_server
+ | Sync ASM rebalance : 0.40
+ | SQL*Net break/reset to clien : 0.52
+ | Failed Logon Delay : 0.38
+ | direct path write temp : 0.25
+ | db file sequential read : -0.25
+ | control file sequential read : 0.45
+ | library cache: mutex X : 0.42
+ | PGA memory operation : 0.55
+ | ASM file metadata operation : NaN
+ | log file sync : 0.34
+ | db file scattered read : -0.06
+ | latch: shared pool : -0.10
+ | CSS operation: action : NaN
+ | SQL*Net message to client : NaN
+ | SQL*Net more data from clien : NaN
+ | cursor: pin S : NaN
+ | latch: call allocation : NaN
+ | library cache load lock : NaN
4068548974 Other Top Sections: SQL CPU [100.00%] | SQL READS [100.00%] | SQL GETS [100.00%]
--- Correlation with DB Time: 0.57 Marked as TOP in 100.00% of probes
--- AVG Ela by Exec: 22.88 STDDEV Ela by Exec: 0.74
--- AVG No. executions: 3.00 STDDEV No. executions: 0.00
MODULE: zabbix_server
+ | Sync ASM rebalance : 0.42
+ | SQL*Net break/reset to clien : 0.52
+ | Failed Logon Delay : 0.42
+ | direct path write temp : 0.11
+ | db file sequential read : -0.09
+ | control file sequential read : 0.39
+ | library cache: mutex X : 0.40
+ | PGA memory operation : 0.56
+ | ASM file metadata operation : NaN
+ | log file sync : 0.41
+ | db file scattered read : -0.02
+ | latch: shared pool : -0.01
+ | CSS operation: action : NaN
+ | SQL*Net message to client : NaN
+ | SQL*Net more data from clien : NaN
+ | cursor: pin S : NaN
+ | latch: call allocation : NaN
+ | library cache load lock : NaN
4100600891 Other Top Sections: SQL CPU [45.76%] | SQL READS [45.76%] | SQL GETS [45.76%]
--- Correlation with DB Time: 0.23 Marked as TOP in 100.00% of probes
--- AVG Ela by Exec: 0.01 STDDEV Ela by Exec: 0.00
--- AVG No. executions: 2989.75 STDDEV No. executions: 304.54
MODULE: ?
+ | Sync ASM rebalance : 0.99
+ | SQL*Net break/reset to clien : 0.19
+ | Failed Logon Delay : 0.20
+ | direct path write temp : -0.06
+ | db file sequential read : -0.09
+ | control file sequential read : 0.15
+ | library cache: mutex X : 0.18
+ | PGA memory operation : 0.17
+ | ASM file metadata operation : NaN
+ | log file sync : 0.25
+ | db file scattered read : 0.09
+ | latch: shared pool : -0.10
+ | CSS operation: action : NaN
+ | SQL*Net message to client : NaN
+ | SQL*Net more data from clien : NaN
+ | cursor: pin S : NaN
+ | latch: call allocation : NaN
+ | library cache load lock : NaN
2116203990 Other Top Sections: SQL CPU [49.15%] | SQL READS [49.15%] | SQL GETS [49.15%]
--- Correlation with DB Time: 0.13 Marked as TOP in 49.15% of probes
--- AVG Ela by Exec: 0.01 STDDEV Ela by Exec: 0.00
--- AVG No. executions: 4881.62 STDDEV No. executions: 11277.56
MODULE: emagent_SQL_oracle_database
+ | Sync ASM rebalance : 0.60
+ | SQL*Net break/reset to clien : 0.10
+ | Failed Logon Delay : 0.14
+ | direct path write temp : -0.00
+ | db file sequential read : -0.10
+ | control file sequential read : -0.15
+ | library cache: mutex X : 0.19
+ | PGA memory operation : 0.09
+ | ASM file metadata operation : NaN
+ | log file sync : 0.14
+ | db file scattered read : -0.01
+ | latch: shared pool : -0.03
+ | CSS operation: action : NaN
+ | SQL*Net message to client : NaN
+ | SQL*Net more data from clien : NaN
+ | cursor: pin S : NaN
+ | latch: call allocation : NaN
+ | library cache load lock : NaN
Statistics
-----------------------------------------------------------------------------------
Correlation of instance statatistics with DB Time for values >= 0.5 and <= -0.5
physical writes direct temporary : -0.57
Heap Segment Array Inserts : -0.55
redo synch time overhead count ( : 0.52
change write time : 0.55
redo synch long waits : 0.64
Client Path Maximum Transmission : 0.71
redo synch time : 0.72
parse count (total) : 0.74
non-idle wait time : 0.76
calls to kcmgas : 0.76
deferred (CURRENT) block cleanout : 0.76
redo synch time (usec) : 0.78
Client Total Bytes Received : 0.80
Client Total Bytes Acked : 0.81
Client Data Segments In : 0.81
redo synch time overhead (usec) : 0.84
Client Data Segments Out : 0.84
concurrency wait time : 0.85
non-idle wait count : 0.86
Client Advertised Receive Window : 0.87
Client Advertised Send Window : 0.87
Client Send Congestion Window : 0.87
Client Time (usec) Round Trip Tim : 0.87
cumulative begin requests : 0.87
cumulative end requests : 0.87
enqueue releases : 0.91
enqueue requests : 0.91
switch current caused by our pin : 0.94
switch current to new buffer : 0.94
bytes received via SQL*Net from c : 0.95
redo write info find : 0.97
bytes sent via SQL*Net to client : 0.98
calls to kcmadj : 0.98
messages sent : 0.98
application wait time : 0.99
Heap Segment Array Updates : 0.99
redo synch writes : 0.99
session uga memory : 0.99
user logouts cumulative : 0.99
Requests to/from client : 0.99
SQL*Net roundtrips to/from client : 0.99
logons cumulative : 0.99
session uga memory max : 0.99
user logons cumulative : 0.99
user calls : 0.99
CPU used when call started : 1.00
Generating Plots
==== DONE ===
JAS-MIN Report saved to: /root/statspack/relatorios/.html_reports/jasmin_.html
6 – Relatórios gerados pela ferramenta jas-min:
[root@localhost .html_reports]# cd /root/statspack/relatorios/.html_reports
[root@localhost .html_reports]# ls -lart
total 668
-rw-r--r--. 1 root root  17641 Mar 13 19:19 fg_Sync_ASM_rebalance.html
-rw-r--r--. 1 root root   7595 Mar 13 19:19 fg_SQL_Net_more_data_from_clien.html
-rw-r--r--. 1 root root  17910 Mar 13 19:19 fg_SQL_Net_message_to_client.html
-rw-r--r--. 1 root root  17535 Mar 13 19:19 fg_PGA_memory_operation.html
-rw-r--r--. 1 root root  17257 Mar 13 19:19 fg_library_cache_mutex_X.html
-rw-r--r--. 1 root root  12169 Mar 13 19:19 fg_library_cache_load_lock.html
-rw-r--r--. 1 root root  13697 Mar 13 19:19 fg_latch_shared_pool.html
-rw-r--r--. 1 root root  10169 Mar 13 19:19 fg_latch_call_allocation.html
-rw-r--r--. 1 root root  13111 Mar 13 19:19 fg_Failed_Logon_Delay.html
-rw-r--r--. 1 root root  17647 Mar 13 19:19 fg_direct_path_write_temp.html
-rw-r--r--. 1 root root  17896 Mar 13 19:19 fg_db_file_sequential_read.html
-rw-r--r--. 1 root root   8435 Mar 13 19:19 fg_db_file_scattered_read.html
-rw-r--r--. 1 root root  13079 Mar 13 19:19 fg_cursor_pin_S.html
-rw-r--r--. 1 root root  17662 Mar 13 19:19 fg_CSS_operation_action.html
-rw-r--r--. 1 root root  17985 Mar 13 19:19 fg_control_file_sequential_read.html
-rw-r--r--. 1 root root  17920 Mar 13 19:19 fg_ASM_file_metadata_operation.html
-rw-r--r--. 1 root root  13147 Mar 13 19:19 fg_SQL_Net_break_reset_to_clien.html
-rw-r--r--. 1 root root  17192 Mar 13 19:19 fg_log_file_sync.html
-rw-r--r--. 1 root root  11837 Mar 13 19:19 bg_SQL_Net_message_to_client.html
-rw-r--r--. 1 root root  10366 Mar 13 19:19 bg_row_cache_mutex.html
-rw-r--r--. 1 root root  12273 Mar 13 19:19 bg_db_file_sequential_read.html
-rw-r--r--. 1 root root  17985 Mar 13 19:19 bg_control_file_sequential_read.html
-rw-r--r--. 1 root root  12638 Mar 13 19:19 bg_enq_CR_-_block_range_reuse.html
-rw-r--r--. 1 root root   8851 Mar 13 19:19 bg_Disk_file_operations_I_O.html
-rw-r--r--. 1 root root  17589 Mar 13 19:19 bg_Sync_ASM_rebalance.html
-rw-r--r--. 1 root root  14159 Mar 13 19:19 bg_reliable_message.html
-rw-r--r--. 1 root root  17535 Mar 13 19:19 bg_PGA_memory_operation.html
-rw-r--r--. 1 root root   6942 Mar 13 19:19 bg_log_file_sync.html
-rw-r--r--. 1 root root  12823 Mar 13 19:19 bg_latch_shared_pool.html
-rw-r--r--. 1 root root   6203 Mar 13 19:19 bg_db_file_scattered_read.html
-rw-r--r--. 1 root root  17954 Mar 13 19:19 bg_control_file_parallel_write.html
-rw-r--r--. 1 root root   5439 Mar 13 19:19 bg_cursor_pin_S.html
drwxr-xr-x. 3 root root   4096 Mar 13 19:19 ..
-rw-r--r--. 1 root root   2576 Mar 13 19:19 1001968173.html
-rw-r--r--. 1 root root   2765 Mar 13 19:19 3201705521.html
-rw-r--r--. 1 root root   2868 Mar 13 19:19 4068548974.html
-rw-r--r--. 1 root root   2603 Mar 13 19:19 4100600891.html
-rw-r--r--. 1 root root   2631 Mar 13 19:19 2116203990.html
drwxr-xr-x. 2 root root   4096 Mar 13 19:19 .
-rw-r--r--. 1 root root   5738 Mar 13 19:19 statistics_corr.html
-rw-r--r--. 1 root root 115122 Mar 13 19:19 jasmin_.html
-rw-r--r--. 1 root root   7405 Mar 13 19:19 jasmin_highlight.html
7 – Abrindo o relatório em HTML da página principal jasmin.html para análise:
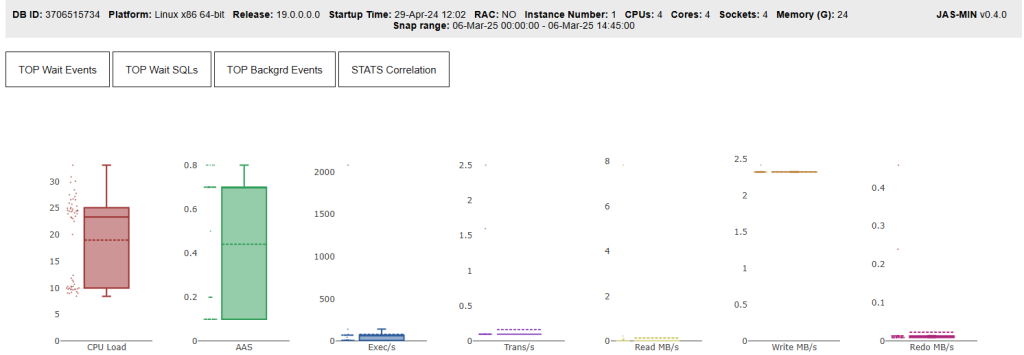
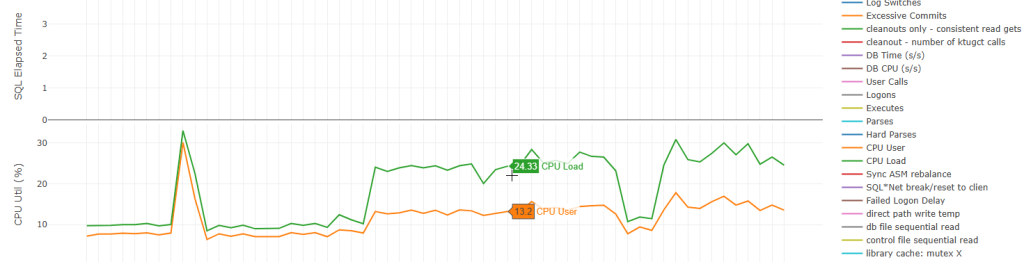
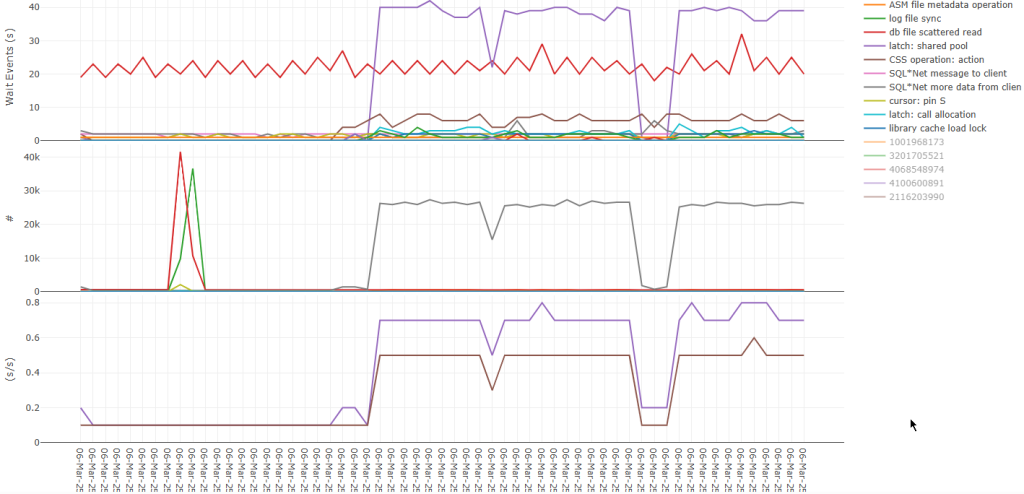
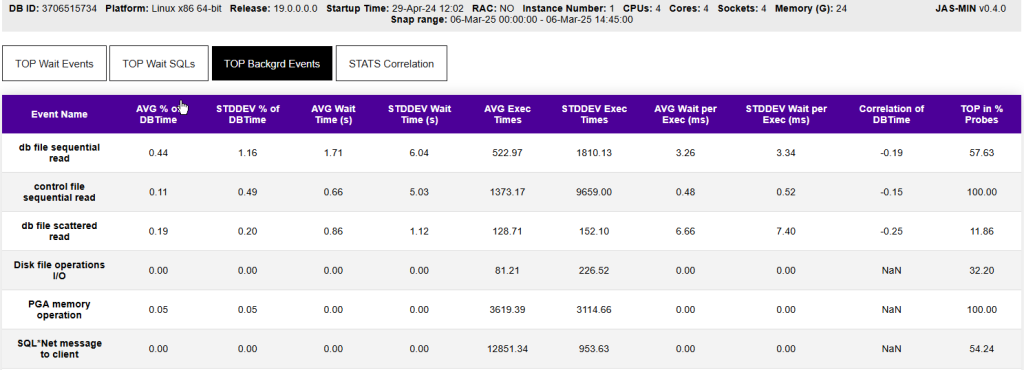
Utilizei um ambiente de testes sem workload para demonstração. Em ambientes com workload, esse relatório apresentará uma riqueza ainda maior de informações e detalhes.
Um agradecimento especial a Kamil Stawiarski e Radosław Kut por desenvolverem e disponibilizarem esta ferramenta para a comunidade.