
Há algum tempo, descobri, por meio de um post no LinkedIn do Anders Swanson, a ferramenta de monitoramento AI Database Metrics Exporter, baseada no OpenTelemetry. Achei a ferramenta bastante interessante e decidi instalá-la para conhecê-la melhor e realizar alguns testes.
A ferramenta pode ser instalada e utilizada de diferentes formas. Uma dessas opções é por meio do modo Standalone Binary. No entanto, ao consultar a documentação oficial, percebi que os passos para instalação e configuração não estavam muito claros.
Diante disso, resolvi criar este post com o objetivo de apresentar, de forma simples e prática, o processo de instalação e configuração da ferramenta no modo Standalone Binary, facilitando o uso para quem deseja testá-la ou utilizá-la em seu ambiente.
- Versão do sistema operacional utilizada:
[root@localhost ~]# uname -a
Linux localhost.localdomain 5.15.0-301.163.5.2.el8uek.x86_64 #2 SMP Wed Oct 16 18:57:13 PDT 2024 x86_64 x86_64 x86_64 GNU/Linux
[root@localhost ~]# cat /etc/*-release | grep PRETTY
PRETTY_NAME="Oracle Linux Server 8.10"
- Configuração do hostname e do firewall do servidor onde será instalado o Oracle AI Database Metrics Exporter (Standalone Binary).
#Change hostname
[root@localhost ~]# dnf install wget zip unzip rsync -y
[root@localhost ~]# dnf install net-tools -y
[root@localhost ~]# dnf install -y mlocate
[root@localhost ~]# updatedb
[root@localhost ~]# hostnamectl set-hostname srvexporter.local
[root@localhost ~]# init 6
[root@srvexporter ~]# hostnamectl status
   Static hostname: srvexporter.local
         Icon name: computer-vm
           Chassis: vm
        Machine ID: 281bcc58a1774cdda00f7714cf6fcc6a
           Boot ID: 7433629a26b0427b9bf975eb88e2a780
    Virtualization: vmware
  Operating System: Oracle Linux Server 8.10
       CPE OS Name: cpe:/o:oracle:linux:8:10:server
            Kernel: Linux 5.15.0-301.163.5.2.el8uek.x86_64
      Architecture: x86-64


#hosts
[root@srvexporter ~]# cat >> /etc/hosts << EOF
192.168.68.102 srvexporter.local srvexporter
EOF


#Configure Firewall
[root@srvexporter ~]# firewall-cmd --get-active-zones
public
  interfaces: ens160

[root@srvexporter ~]# firewall-cmd --zone=public --add-port=9161/tcp --permanent
success
[root@srvexporter ~]# firewall-cmd --zone=public --add-port=9162/tcp --permanent
success
[root@srvexporter ~]# firewall-cmd --zone=public --add-port=3000/tcp --permanent
success
[root@srvexporter ~]# firewall-cmd --zone=public --add-port=9090/tcp --permanent
success
[root@srvexporter ~]# firewall-cmd --reload
success
[root@srvexporter ~]# firewall-cmd --list-all
public (active)
  target: default
  icmp-block-inversion: no
  interfaces: ens160
  sources:
  services: cockpit dhcpv6-client ssh
  ports: 9161/tcp 3000/tcp 9090/tcp
  protocols:
  forward: no
  masquerade: no
  forward-ports:
  source-ports:
  icmp-blocks:
  rich rules:

#SELINUX
[root@srvexporter ~]# cat /etc/selinux/config
# This file controls the state of SELinux on the system.
# SELINUX= can take one of these three values:
#     enforcing - SELinux security policy is enforced.
#     permissive - SELinux prints warnings instead of enforcing.
#     disabled - No SELinux policy is loaded.
SELINUX=enforcing
# SELINUXTYPE= can take one of these three values:
#     targeted - Targeted processes are protected,
#     minimum - Modification of targeted policy. Only selected processes are protected.
#     mls - Multi Level Security protection.
SELINUXTYPE=targeted


[root@srvexporter ~]# sed -i 's/SELINUX=enforcing/SELINUX=disabled/g' /etc/selinux/config
[root@srvexporter ~]# setenforce 0
- Desative o IPV6 da interface de rede.
- Crie o usuário na instância ou no PDB que você deseja monitorar no banco de dados Oracle:
CREATE USER USR_EXPORTER IDENTIFIED BY "USR_EXPORTER";
GRANT CREATE SESSION,RESOURCE TO USR_EXPORTER;
GRANT SELECT ANY DICTIONARY TO USR_EXPORTER;


[oracle@srv02 ~]$ . oraenv
ORACLE_SID = [lab19c] ?
The Oracle base remains unchanged with value /u01/app/oracle
[oracle@srv02 ~]$ export ORACLE_PDB_SID=PRD1
[oracle@srv02 ~]$ sqlplus / as sysdba

SQL*Plus: Release 19.0.0.0.0 - Production on Fri Mar 6 21:43:44 2026
Version 19.25.0.0.0

Copyright (c) 1982, 2024, Oracle.  All rights reserved.


Connected to:
Oracle Database 19c Enterprise Edition Release 19.0.0.0.0 - Production
Version 19.25.0.0.0

SQL> show pdbs

    CON_ID CON_NAME                       OPEN MODE  RESTRICTED
---------- ------------------------------ ---------- ----------
         3 PRD1                           READ WRITE NO
SQL> CREATE USER USR_EXPORTER IDENTIFIED BY "USR_EXPORTER";
GRANT CREATE SESSION,RESOURCE TO USR_EXPORTER;
GRANT SELECT ANY DICTIONARY TO USR_EXPORTER;

User created.

SQL>
Grant succeeded.

SQL>

Grant succeeded.
- Instale o Oracle Instant Client Basic:
[root@srvexporter oracledb_exporter-2.2.2.linux-amd64]# dnf install -y oracle-instantclient-release-el8
[root@srvexporter oracledb_exporter-2.2.2.linux-amd64]# dnf install -y oracle-instantclient-basic oracle-instantclient-devel
[root@srvexporter oracledb_exporter-2.2.2.linux-amd64]# dnf install -y oracle-instantclient-sqlplus- Para instalar o Oracle AI Database Metrics Exporter, baixe o binário standalone e o arquivo de configuração default-metrics.toml. Em seguida, extraia os arquivos e siga os passos abaixo:
[root@srvexporter ~]# mkdir -p /exporter/
[root@srvexporter ~]# cd /exporter/
#create log file
[root@srvexporter ~]#> /exporter/alert.log
[root@srvexporter exporter]# wget https://github.com/oracle/oracle-db-appdev-monitoring/releases/download/2.2.2/oracledb_exporter-2.2.2.linux-amd64-glibc-2.28.tar.gz
[root@srvexporter exporter]# wget https://github.com/oracle/oracle-db-appdev-monitoring/releases/download/2.2.2/default-metrics.toml
[root@srvexporter exporter]# tar -zxvf oracledb_exporter-2.2.2.linux-amd64-glibc-2.28.tar.gz
oracledb_exporter-2.2.2.linux-amd64/
oracledb_exporter-2.2.2.linux-amd64/oracledb_exporter
[root@srvexporter exporter]# mv default-metrics.toml exporter-config.yaml oracledb_exporter-2.2.2.linux-amd64
[root@srvexporter exporter]#
- Edite o arquivo de configuração exporter-config.yaml se não estiver utilizando ambiente multitenant. Utilize o exemplo abaixo, altere os dados de acesso ao banco de dados e o diretório de logs:
[root@srvexporter oracledb_exporter-2.2.2.linux-amd64]# cd /exporter/oracledb_exporter-2.2.2.linux-amd64
[root@srvexporter oracledb_exporter-2.2.2.linux-amd64]# pwd
/exporter/oracledb_exporter-2.2.2.linux-amd64

[root@srvexporter oracledb_exporter-2.2.2.linux-amd64]# cat exporter-config.yaml
databases:
  ## Path on which metrics will be served
  #metricsPath: /metrics
  ## Database connection information for the "default" database.
  default:
    ## Database username
    username: USR_EXPORTER
    ## Database password
    password: USR_EXPORTER
    ## Database password file
    ## If specified, will load the database password from a file.
    # passwordFile: ${DB_PASSWORD_FILE}
    ## Database connection url
    url: 192.168.68.114:1521/PRD1

    ## Metrics query timeout for this database, in seconds
    queryTimeout: 10

    ## Rely on Oracle AI Database External Authentication by network or OS
    # externalAuth: false
    ## Database role
    # role: SYSDBA
    ## Path to Oracle AI Database wallet, if using wallet
    # tnsAdmin: /path/to/database/wallet

    ### Connection settings:
    ### Either the go-sql or Oracle AI Database connection pool may be used.
    ### To use the Oracle AI Database connection pool over the go-sql connection pool,
    ### set maxIdleConns to zero and configure the pool* settings.

    ### Connection pooling settings for the go-sql connection pool
    ## Max open connections for this database using go-sql connection pool
    maxOpenConns: 10
    ## Max idle connections for this database using go-sql connection pool
    maxIdleConns: 10

    ### Connection pooling settings for the Oracle AI Database connection pool
    ## Oracle AI Database connection pool increment.
    # poolIncrement: 1
    ## Oracle AI Database Connection pool maximum size
    # poolMaxConnections: 15
    ## Oracle AI Database Connection pool minimum size
    # poolMinConnections: 15

    ## Arbitrary labels to add to each metric scraped from this database
    # labels:
    #   label_name1: label_value1
    #   label_name2: label_value2

metrics:
  ## The name of the database label applied to each metric. "database" by default.
  # databaseLabel: database
  ## How often to scrape metrics. If not provided, metrics will be scraped on request.
  # scrapeInterval: 15s
  ## Path to default metrics file.
  default: default-metrics.toml
  ## Paths to any custom metrics files
  #custom: - custom-metrics-example/custom-metrics.toml

log:
  # Path of log file
  destination: /exporter/alert.log
  # Interval of log updates
  interval: 15s
  ## Set disable to 1 to disable logging
  # disable: 0

# Optionally configure prometheus webserver
#web:
#  listenAddresses: [':9161']
#  systemdSocket: true|false
#  configFile: /path/to/webconfigfile

# Remove invalid character
[root@srvexporter oracledb_exporter-2.2.2.linux-amd64]# sed -i 's/\t/ /g' exporter-config.yamlAjuste o arquivo de configuração exporter-config.yaml para ambiente multitenant, utilizando o exemplo abaixo. Altere os dados de acesso ao banco de dados conforme o seu ambiente. Neste exemplo, db0 representa o CDB que contém os PDBs prd1 e prd2. Em seguida, configure o diretório de logs:
[root@srvexporter oracledb_exporter-2.2.2.linux-amd64]# cat exporter-config.yaml
databases:
  db1:
    ## Database username
    username: USR_EXPORTER
    ## Database password
    password: USR_EXPORTER
    ## Database connection url
    url: 192.168.68.114:1521/PRD1

    ## Metrics query timeout for this database, in seconds
    queryTimeout: 5

    ### Connection pooling settings for the go-sql connection pool
    ## Max open connections for this database using go-sql connection pool
    maxOpenConns: 10
    ## Max idle connections for this database using go-sql connection pool
    maxIdleConns: 10

  db2:
    ## Database username
    username: USR_EXPORTER
    ## Database password
    password: USR_EXPORTER
    ## Database connection url
    url: 192.168.68.114:1521/PRD2

    ## Metrics query timeout for this database, in seconds
    queryTimeout: 5

    ### Connection pooling settings for the go-sql connection pool
    ## Max open connections for this database using go-sql connection pool
    maxOpenConns: 10
    ## Max idle connections for this database using go-sql connection pool
    maxIdleConns: 10

metrics:
  ## The name of the database label applied to each metric. "database" by default.
  # databaseLabel: database
  ## How often to scrape metrics. If not provided, metrics will be scraped on request.
  # scrapeInterval: 15s
  ## Path to default metrics file.
  default: default-metrics.toml
  ## Paths to any custom metrics files
  #custom: - custom-metrics-example/custom-metrics.toml

log:
  # Path of log file
  destination: /exporter/alert.log
  # Interval of log updates
  interval: 15s
- Configure o arquivo com as consultas SQL que serão coletadas para gerar os gráficos no Grafana. Essa flexibilidade na criação das consultas para coleta de dados é fantástica, pois elimina a necessidade de utilizar o Tuning Pack. Além disso, permite monitorar qualquer indicador baseado em consultas SQL que você considerar necessário.
- Por padrão, o arquivo default-metrics.toml já contém diversas consultas utilizadas pelo dashboard principal. No entanto, você pode criar novos dashboards facilmente, bastando adicionar as consultas SQL que desejar para coletar os indicadores que pretende monitorar.
[root@srvexporter ~]# cat default-metrics.toml
[[metric]]
context = ""
metricsdesc = { dbtype="Type of database the exporter is connected to (0=non-CDB, 1=CDB, >1=PDB)." }
request = '''
select sys_context('USERENV', 'CON_ID') as dbtype
from dual
'''

[[metric]]
context = "sessions"
labels = [ "inst_id", "status", "type" ]
metricsdesc = { value= "Gauge metric with count of sessions by inst_id, status and type." }
request = '''
select inst_id, status, type, count(*) as value
from gv$session
group by inst_id, status, type
'''

[[metric]]
context = "resource"
labels = [ "inst_id", "resource_name" ]
metricsdesc = { current_utilization= "Generic counter metric from gv$resource_limit view in Oracle (current value).", limit_value="Generic counter metric from v$resource_limit view in Oracle (UNLIMITED: -1)." }
request = '''
select inst_id, resource_name, current_utilization, case when trim(limit_value) like 'UNLIMITED' then '-1' else trim(limit_value) end as limit_value
from gv$resource_limit
group by inst_id, resource_name, current_utilization, limit_value
'''
ignorezeroresult = true

[[metric]]
context = "asm_diskgroup"
labels = [ "inst_id", "name" ]
metricsdesc = { total = "Total size of ASM disk group.", free = "Free space available on ASM disk group." }
request = '''
select inst_id, name, total_mb*1024*1024 as total, free_mb*1024*1024 as free
from gv$asm_diskgroup_stat
where exists (select 1 from gv$datafile where name like '+%')
and inst_id = (select max(inst_id) from gv$instance)
group by inst_id, name, total_mb, free_mb
'''
ignorezeroresult = true

[[metric]]
context = "activity"
labels = [ "inst_id" ]
metricsdesc = { value="Generic counter metric from gv$sysstat view in Oracle." }
fieldtoappend = "name"
request = '''
select inst_id, name, value from gv$sysstat
where name in ('parse count (total)', 'execute count', 'user commits', 'user rollbacks')
group by inst_id, name, value
'''

[[metric]]
context = "process"
labels = [ "inst_id" ]
metricsdesc = { count="Gauge metric with count of processes." }
request = '''
select inst_id, count(*) as count
from gv$process
group by inst_id
'''

[[metric]]
context = "wait_time"
labels = [ "inst_id", "wait_class", "con_id" ]
metricsdesc = { time_waited_sec_total="counter metric from system_wait_class view in Oracle." }
metricstype = { time_waited_sec_total = "counter" }
fieldtoappend= "wait_class"
request = '''
select
    inst_id,
    wait_class,
    round(time_waited/100,3) time_waited_sec_total,
    con_id
from gv$system_wait_class
where wait_class <> 'Idle'
group by inst_id, wait_class, con_id, round(time_waited/100,3)
'''
ignorezeroresult = true

[[metric]]
context = "tablespace"
labels = [ "tablespace", "type" ]
metricsdesc = { bytes = "Generic counter metric of tablespaces bytes in Oracle.", max_bytes = "Generic counter metric of tablespaces max bytes in Oracle.", free = "Generic counter metric of tablespaces free bytes in Oracle.", used_percent = "Gauge metric showing as a percentage of how much of the tablespace has been used." }
request = '''
SELECT
    dt.tablespace_name as tablespace,
    dt.contents as type,
    dt.block_size * dtum.used_space as bytes,
    dt.block_size * dtum.tablespace_size as max_bytes,
    dt.block_size * (dtum.tablespace_size - dtum.used_space) as free,
    dtum.used_percent
FROM  dba_tablespace_usage_metrics dtum, dba_tablespaces dt
WHERE dtum.tablespace_name = dt.tablespace_name
and dt.contents != 'TEMPORARY'
union
SELECT
    dt.tablespace_name as tablespace,
    'TEMPORARY' as type,
    dt.tablespace_size - dt.free_space as bytes,
    dt.tablespace_size as max_bytes,
    dt.free_space as free,
    ((dt.tablespace_size - dt.free_space) / dt.tablespace_size)
FROM  dba_temp_free_space dt
order by tablespace
'''

[[metric]]
context = "db_system"
labels = [ "inst_id", "name" ]
metricsdesc = { value = "Database system resources metric" }
request = '''
select inst_id, name, value
from gv$parameter
where name in ('cpu_count', 'sga_max_size', 'pga_aggregate_limit')
group by inst_id, name, value
'''

[[metric]]
context = "db_platform"
labels = [ "inst_id", "platform_name" ]
metricsdesc = { value = "Database platform" }
request = '''
SELECT inst_id, platform_name, 1 as value
FROM gv$database
GROUP BY inst_id, platform_name
'''

[[metric]]
context = "top_sql"
labels = [ "inst_id", "sql_id", "sql_text" ]
metricsdesc = { elapsed = "SQL statement elapsed time running" }
request = '''
select * from (
select inst_id, sql_id, elapsed_time / 1000000 as elapsed, substrb(replace(sql_text,'',' '),1,55) as sql_text
from   gv$sqlstats
order by elapsed_time desc
) where rownum <= 15
'''
ignorezeroresult = true
querytimeout = "10s"
# scrapeinterval = "5m"
# The previous line is an example of changing the interval at which this one metric
# will be scraped. You may wish to do this to scrape a metric less often, if the SQL
# statement to collect that metric places more load on your database instance than
# desired when it is run at every scrape.

[[metric]]
context = "cache_hit_ratio"
labels = [ "inst_id", "cache_hit_type" ]
metricsdesc = { value = "Cache Hit Ratio" }
request = '''
select metric_name cache_hit_type, value
from gv$sysmetric
where group_id=2 and metric_id in (2000,2050,2112,2110)
'''
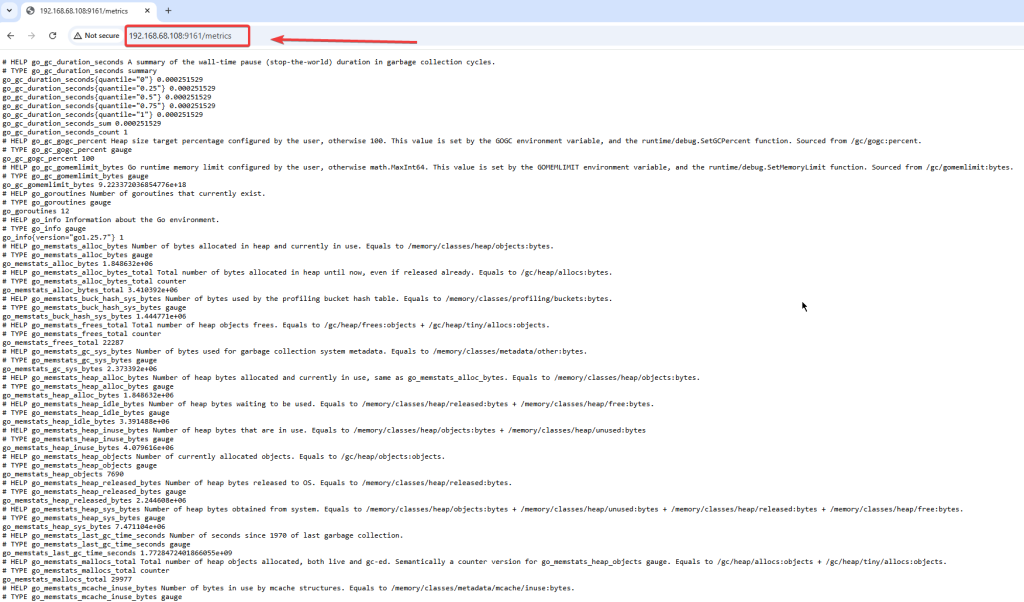
- Start e verifique se o acesso ao Exporter esta funcionando correntamente:
[root@srvexporter oracledb_exporter-2.2.2.linux-amd64]# ./oracledb_exporter --config.file=exporter-config.yaml
time=2026-03-06T22:32:43.185-03:00 level=INFO source=main.go:74 msg="FREE_INTERVAL end var is not present, will not periodically attempt to release memory"
time=2026-03-06T22:32:43.185-03:00 level=INFO source=main.go:81 msg="RESTART_INTERVAL env var is not present, so will not restart myself periodically"
time=2026-03-06T22:32:43.185-03:00 level=INFO source=collector.go:67 msg="Initializing database" database=default
time=2026-03-06T22:32:43.185-03:00 level=INFO source=connect_godror.go:32 msg="Using Username/Password Authentication." database=default
time=2026-03-06T22:32:43.284-03:00 level=INFO source=database.go:159 msg="Connected as SYSDBA? FALSE" database=default
time=2026-03-06T22:32:45.162-03:00 level=INFO source=main.go:123 msg="Starting oracledb_exporter" version=2.2.2
time=2026-03-06T22:32:45.162-03:00 level=INFO source=main.go:124 msg="Build context" build="(go=go1.25.7, platform=linux/amd64, user=, date=, tags=godror)"
time=2026-03-06T22:32:45.162-03:00 level=INFO source=main.go:125 msg="Collect from: " metricPath=/metrics
time=2026-03-06T22:32:45.162-03:00 level=INFO source=main.go:178 msg="Exporting alert logs to /exporter/alert.log"
time=2026-03-06T22:32:45.163-03:00 level=INFO source=tls_config.go:354 msg="Listening on" address=[::]:9161
time=2026-03-06T22:32:45.163-03:00 level=INFO source=tls_config.go:357 msg="TLS is disabled." http2=false address=[::]:9161
- Acesse a url do Exporter usando o IP do servidor e porta 9161:
- Instale e configure o Prometheus:
#https://prometheus.io/download/
[root@srvexporter exporter]# pwd
/exporter
[root@srvexporter exporter]# wget https://github.com/prometheus/prometheus/releases/download/v3.10.0/prometheus-3.10.0.linux-amd64.tar.gz
[root@srvexporter exporter]# tar xvfz prometheus-*.tar.gz
prometheus-3.10.0.linux-amd64/
prometheus-3.10.0.linux-amd64/LICENSE
prometheus-3.10.0.linux-amd64/prometheus.yml
prometheus-3.10.0.linux-amd64/promtool
prometheus-3.10.0.linux-amd64/prometheus
prometheus-3.10.0.linux-amd64/NOTICE
- Configure o prometheus para acessar o exporter na porta 9161 e execute:
o[root@srvexporter prometheus-3.10.0.linux-amd64]# cat prometheus.yml
# my global config
global:
  scrape_interval: 15s # Set the scrape interval to every 15 seconds. Default is every 1 minute.
  evaluation_interval: 15s # Evaluate rules every 15 seconds. The default is every 1 minute.
  # scrape_timeout is set to the global default (10s).

# Alertmanager configuration
alerting:
  alertmanagers:
    - static_configs:
        - targets:
          # - alertmanager:9093

# Load rules once and periodically evaluate them according to the global 'evaluation_interval'.
rule_files:
  # - "first_rules.yml"
  # - "second_rules.yml"

# A scrape configuration containing exactly one endpoint to scrape:
# Here it's Prometheus itself.
scrape_configs:
  # The job name is added as a label `job=<job_name>` to any timeseries scraped from this config.
  - job_name: "prometheus"

    # metrics_path defaults to '/metrics'
    # scheme defaults to 'http'.

    static_configs:
      - targets: ["localhost:9090"]
       # The label name is added as a label `label_name=<label_value>` to any timeseries scraped from this config.
        labels:
          app: "prometheus"

#Exporter:
  - job_name: "oracle_exporter"
    static_configs:
      - targets: ["localhost:9161"]
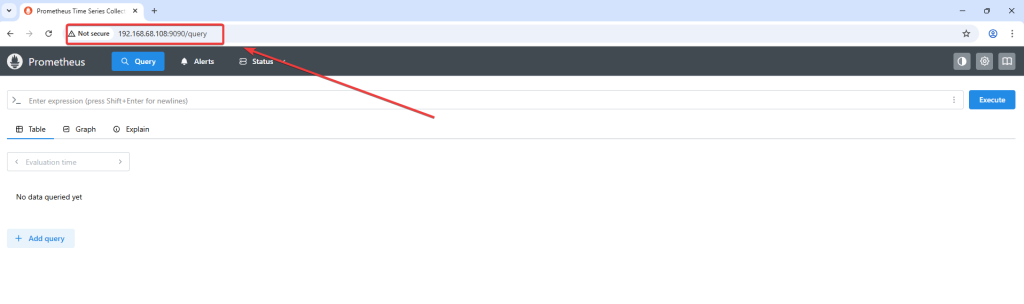
- Start e teste o funcionamento do prometheus na porta 9090:
[root@srvexporter prometheus-3.10.0.linux-amd64]# ./prometheus --config.file=prometheus.yml

time=2026-03-07T09:38:41.067-03:00 level=INFO source=main.go:1611 msg="updated GOGC" old=100 new=75
time=2026-03-07T09:38:41.069-03:00 level=INFO source=main.go:723 msg="Leaving GOMAXPROCS=4: CPU quota undefined" component=automaxprocs
time=2026-03-07T09:38:41.070-03:00 level=INFO source=memlimit.go:198 msg="GOMEMLIMIT is updated" component=automemlimit package=github.com/KimMachineGun/automemlimit/memlimit GOMEMLIMIT=2533032345 previous=9223372036854775807
time=2026-03-07T09:38:41.070-03:00 level=INFO source=main.go:771 msg="No time or size retention was set so using the default time retention" duration=15d
time=2026-03-07T09:38:41.070-03:00 level=INFO source=main.go:822 msg="Starting Prometheus Server" mode=server version="(version=3.10.0, branch=HEAD, revision=54e010926b0a270cadb22be1113ad45fe9bcb90a)"
time=2026-03-07T09:38:41.071-03:00 level=INFO source=main.go:827 msg="operational information" build_context="(go=go1.26.0, platform=linux/amd64, user=root@2ee2be8e6652, date=20260225-21:12:02, tags=netgo,builtinassets)" host_details="(Linux 5.15.0-301.163.5.2.el8uek.x86_64 #2 SMP Wed Oct 16 18:57:13 PDT 2024 x86_64 srvexporter.local (none))" fd_limits="(soft=262143, hard=262144)" vm_limits="(soft=unlimited, hard=unlimited)"
time=2026-03-07T09:38:41.339-03:00 level=INFO source=web.go:696 msg="Start listening for connections" component=web address=0.0.0.0:9090
time=2026-03-07T09:38:41.342-03:00 level=INFO source=main.go:1350 msg="Starting TSDB ..."
time=2026-03-07T09:38:41.343-03:00 level=INFO source=repair.go:54 msg="Found healthy block" component=tsdb mint=1772847597901 maxt=1772848800000 ulid=01KK39GP43E7KJZRE160DD0FYV
time=2026-03-07T09:38:41.346-03:00 level=INFO source=tls_config.go:354 msg="Listening on" component=web address=[::]:9090
time=2026-03-07T09:38:41.346-03:00 level=INFO source=tls_config.go:357 msg="TLS is disabled." component=web http2=false address=[::]:9090
time=2026-03-07T09:38:41.355-03:00 level=INFO source=head.go:680 msg="Replaying on-disk memory mappable chunks if any" component=tsdb
time=2026-03-07T09:38:41.363-03:00 level=INFO source=head.go:766 msg="On-disk memory mappable chunks replay completed" component=tsdb duration=7.972842ms
time=2026-03-07T09:38:41.363-03:00 level=INFO source=head.go:774 msg="Replaying WAL, this may take a while" component=tsdb
time=2026-03-07T09:38:41.424-03:00 level=INFO source=head.go:811 msg="WAL checkpoint loaded" component=tsdb
time=2026-03-07T09:38:41.427-03:00 level=INFO source=head.go:847 msg="WAL segment loaded" component=tsdb segment=7 maxSegment=13 duration=2.944526ms
time=2026-03-07T09:38:41.431-03:00 level=INFO source=head.go:847 msg="WAL segment loaded" component=tsdb segment=8 maxSegment=13 duration=4.089258ms
time=2026-03-07T09:38:41.442-03:00 level=INFO source=head.go:847 msg="WAL segment loaded" component=tsdb segment=9 maxSegment=13 duration=11.499647ms
time=2026-03-07T09:38:41.460-03:00 level=INFO source=head.go:847 msg="WAL segment loaded" component=tsdb segment=10 maxSegment=13 duration=17.419055ms
time=2026-03-07T09:38:41.464-03:00 level=INFO source=head.go:847 msg="WAL segment loaded" component=tsdb segment=11 maxSegment=13 duration=3.930144ms
time=2026-03-07T09:38:41.475-03:00 level=INFO source=head.go:847 msg="WAL segment loaded" component=tsdb segment=12 maxSegment=13 duration=11.404247ms
time=2026-03-07T09:38:41.476-03:00 level=INFO source=head.go:847 msg="WAL segment loaded" component=tsdb segment=13 maxSegment=13 duration=313.013µs
time=2026-03-07T09:38:41.476-03:00 level=INFO source=head.go:884 msg="WAL replay completed" component=tsdb checkpoint_replay_duration=60.361053ms wal_replay_duration=52.271355ms wbl_replay_duration=326ns chunk_snapshot_load_duration=0s mmap_chunk_replay_duration=7.972842ms total_replay_duration=120.717301ms
time=2026-03-07T09:38:41.480-03:00 level=INFO source=main.go:1371 msg="filesystem information" fs_type=XFS_SUPER_MAGIC
time=2026-03-07T09:38:41.480-03:00 level=INFO source=main.go:1374 msg="TSDB started"
time=2026-03-07T09:38:41.481-03:00 level=INFO source=main.go:1564 msg="Loading configuration file" filename=prometheus.yml
time=2026-03-07T09:38:41.484-03:00 level=INFO source=main.go:1604 msg="Completed loading of configuration file" db_storage=2.135µs remote_storage=2.86µs web_handler=832ns query_engine=1.334µs scrape=1.062409ms scrape_sd=229.005µs notify=784.891µs notify_sd=39.385µs rules=68.673µs tracing=49.697µs filename=prometheus.yml totalDuration=3.148573ms
time=2026-03-07T09:38:41.484-03:00 level=INFO source=main.go:1335 msg="Server is ready to receive web requests."
time=2026-03-07T09:38:41.484-03:00 level=INFO source=manager.go:202 msg="Starting rule manager..." component="rule manager"
time=2026-03-07T09:38:55.164-03:00 level=INFO source=compact.go:590 msg="write block started" component=tsdb mint=1772848800000 maxt=1772856000000 ulid=01KK44XMXW8FH7P8ZW5E3MCGNR
time=2026-03-07T09:38:55.218-03:00 level=INFO source=compact.go:627 msg="write block completed" component=tsdb mint=1772848800000 maxt=1772856000000 ulid=01KK44XMXW8FH7P8ZW5E3MCGNR duration=54.310236ms ooo=false
time=2026-03-07T09:38:55.219-03:00 level=INFO source=head.go:1453 msg="Head GC started" component=tsdb caller=truncateMemory
time=2026-03-07T09:38:55.224-03:00 level=INFO source=head.go:1457 msg="Head GC completed" component=tsdb caller=truncateMemory duration=5.110999ms
time=2026-03-07T09:38:55.225-03:00 level=INFO source=compact.go:590 msg="write block started" component=tsdb mint=1772856012901 maxt=1772863200000 ulid=01KK44XMZSAABT78NZTRTS745J
time=2026-03-07T09:38:55.281-03:00 level=INFO source=compact.go:627 msg="write block completed" component=tsdb mint=1772856012901 maxt=1772863200000 ulid=01KK44XMZSAABT78NZTRTS745J duration=56.101597ms ooo=false
time=2026-03-07T09:38:55.283-03:00 level=INFO source=head.go:1453 msg="Head GC started" component=tsdb caller=truncateMemory
time=2026-03-07T09:38:55.291-03:00 level=INFO source=head.go:1457 msg="Head GC completed" component=tsdb caller=truncateMemory duration=8.707726ms
time=2026-03-07T09:38:55.292-03:00 level=INFO source=checkpoint.go:99 msg="Creating checkpoint" component=tsdb from_segment=7 to_segment=10 mint=1772863200000
time=2026-03-07T09:38:55.329-03:00 level=INFO source=head.go:1418 msg="WAL checkpoint complete" component=tsdb first=7 last=10 duration=37.092926ms
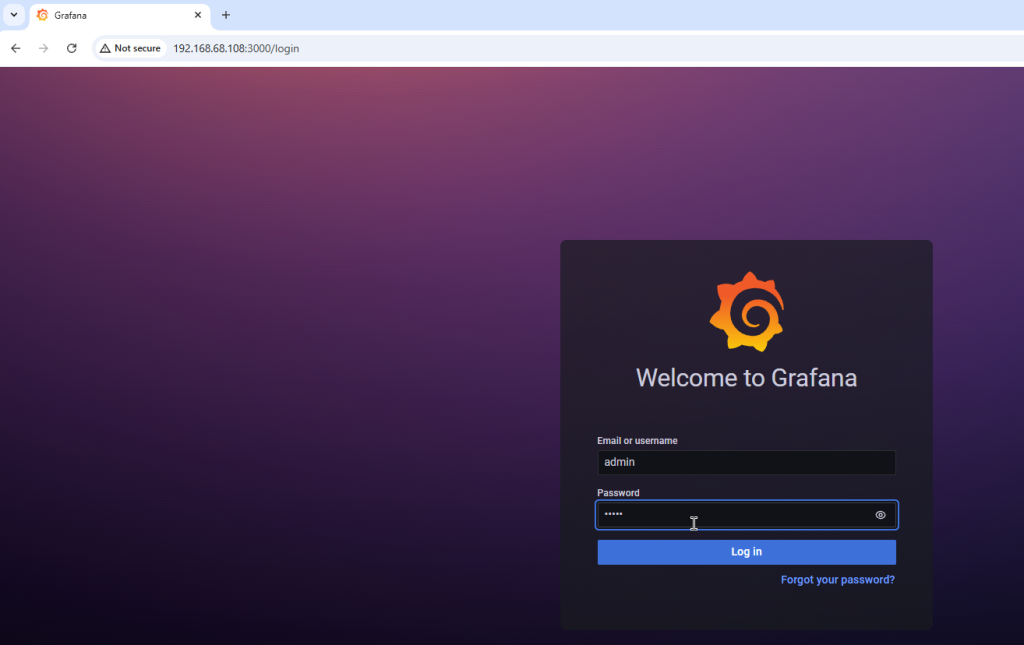
- Instale o grafana, acesse usuando o usuário e senha admin, crie o data source, e importe os graficos do grafana:
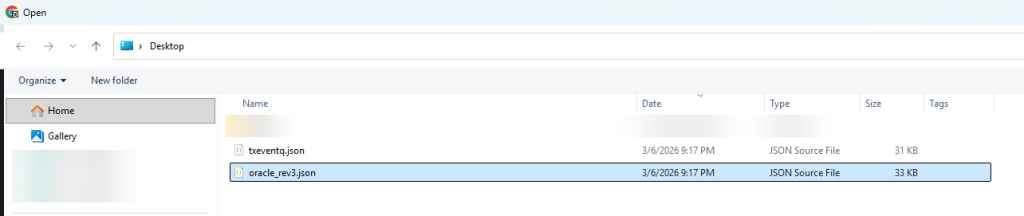
- Faça o download os arquivos oracle_rev3.json e txeventq.json na url: https://github.com/oracle/oracle-db-appdev-monitoring/tree/main/docker-compose/grafana/dashboards
dnf install grafana
systemctl daemon-reload
systemctl enable grafana-server
systemctl start grafana-server
systemctl status grafana-serverUrl do grafana: http://192.168.68.108:3000/
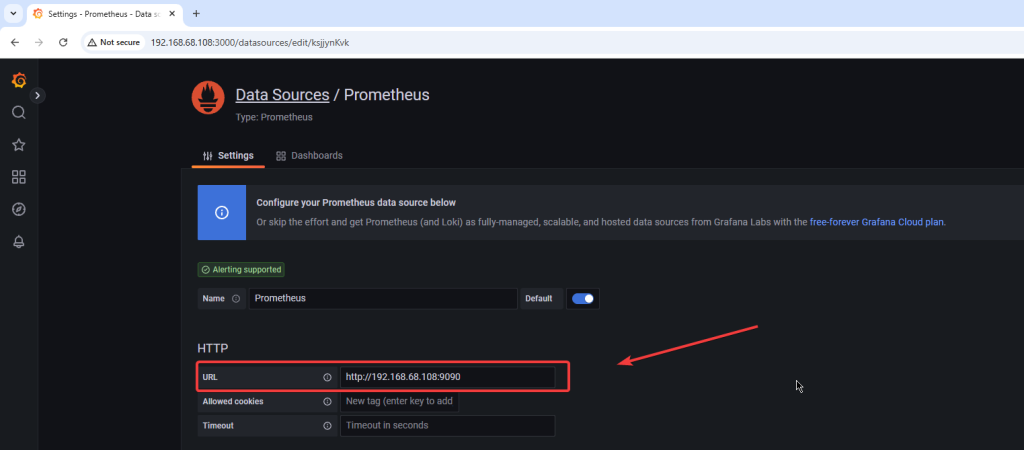
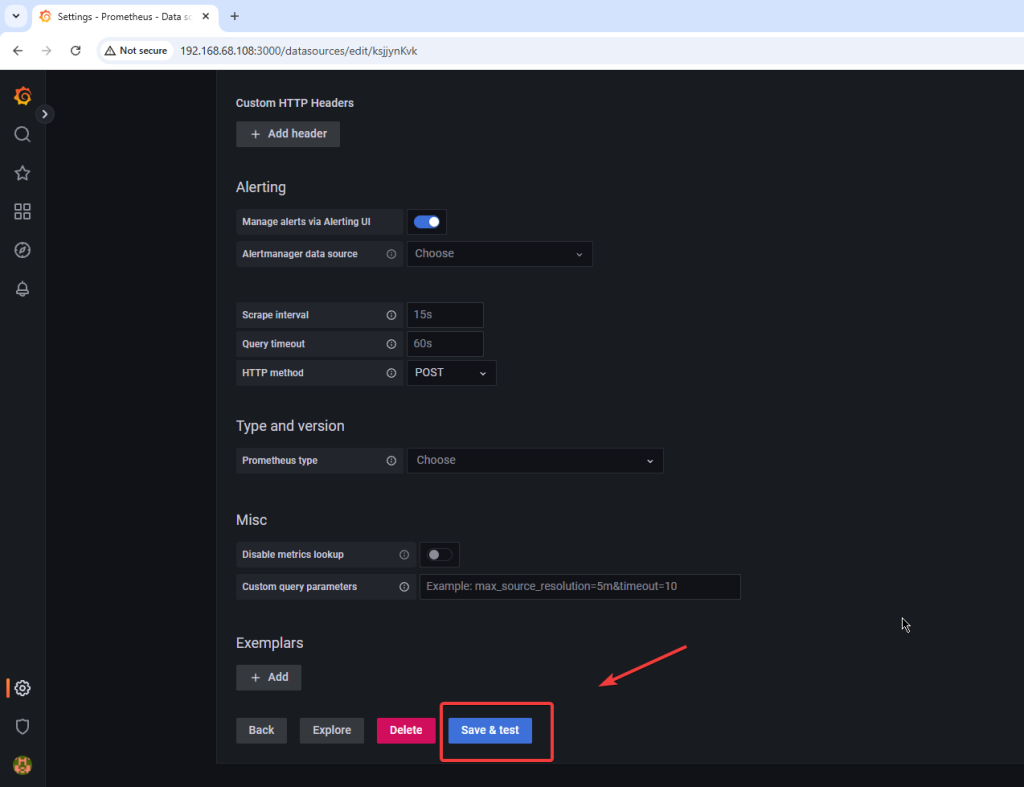
Crie o data souce apontando para o prometheus:
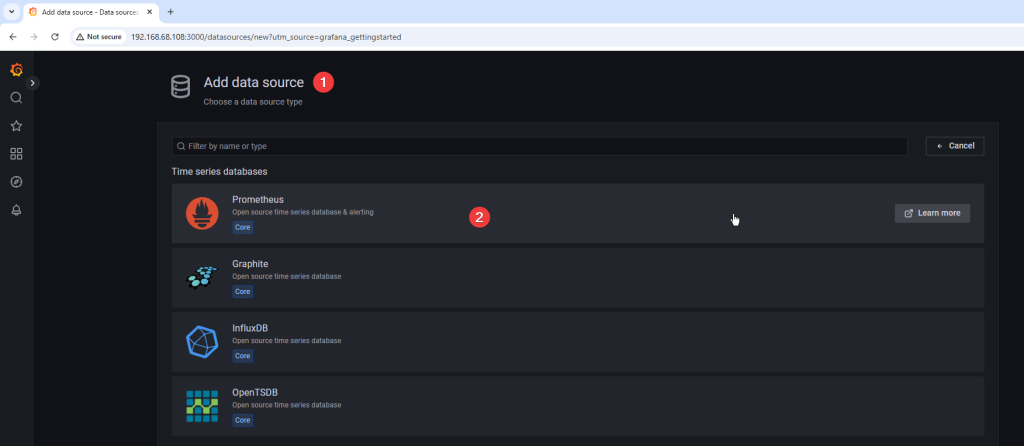
- Insira a url do prometheus, neste exemplo http://192.168.68.108:9090
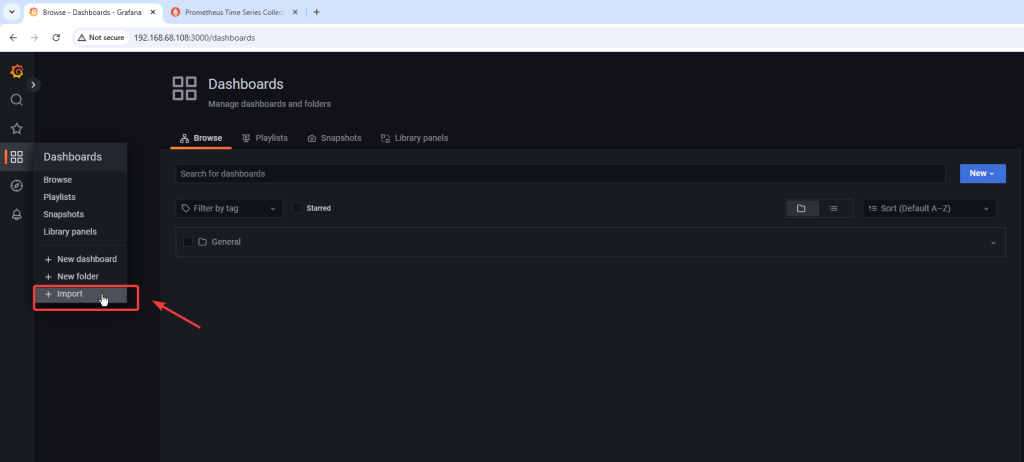
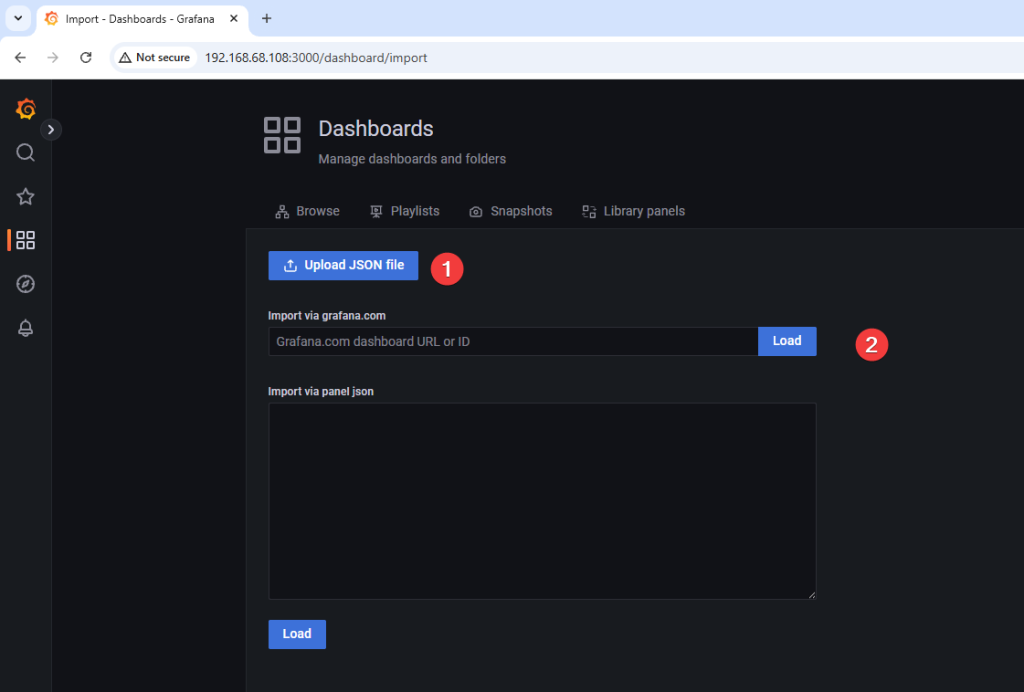
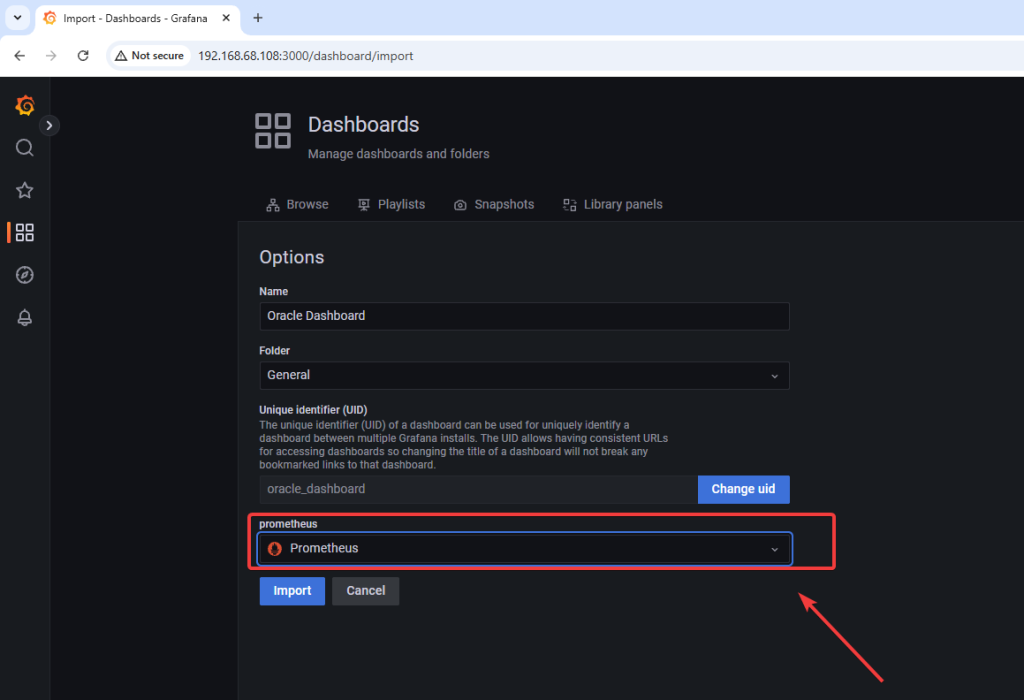
- Importe o grafico de performance que sera usado no grafana no formato json:
- Faça o download do arquivo oracle_rev3.json na url: https://github.com/oracle/oracle-db-appdev-monitoring/tree/main/docker-compose/grafana/dashboards
- Se o arquivo JSON do dashboard apresentar problema durante a importe no Grafana, utilize o arquivo que modifiquei: https://gist.github.com/cesardba/cd26b10846ae9c12612f5961db501f40
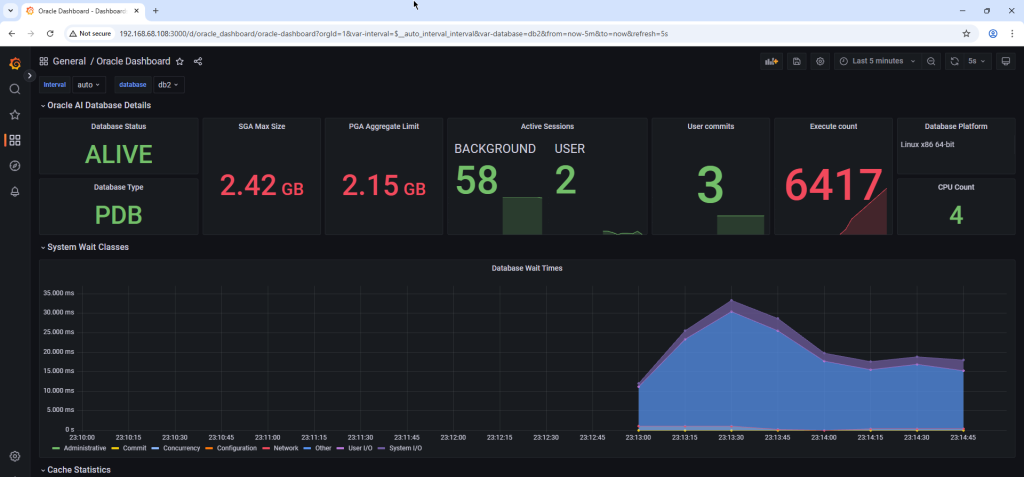
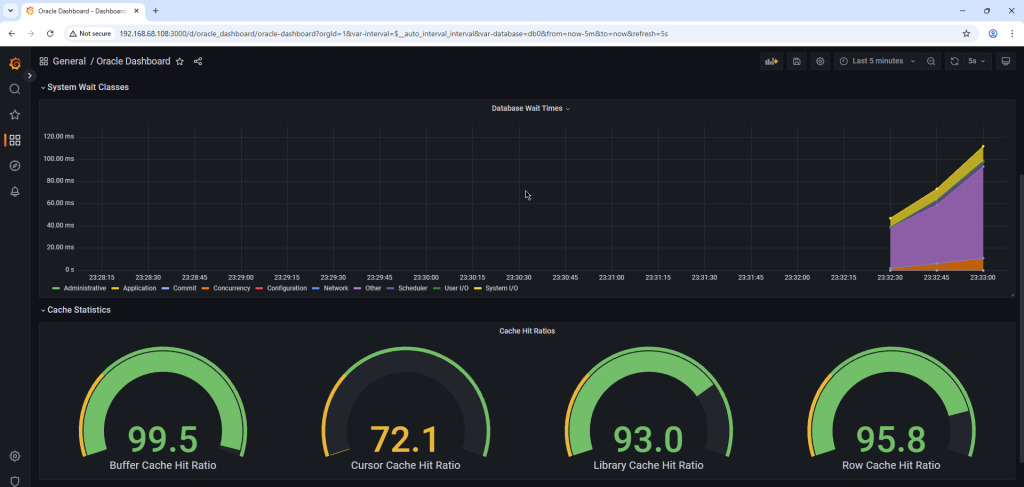
Dashboard importado com sucesso e disponivel para uso:
Espero que este tutorial possa ajudá-lo a implementar um excelente monitoramento para seus bancos de dados Oracle.
Referencias:
https://oracle.github.io/oracle-db-appdev-monitoring
https://oracle.github.io/oracle-db-appdev-monitoring/docs/getting-started/basics